Initial Fedora server setup with Podman
/ 6 min read
Now is the time to show my server configuration and provide an example on the application deployments. My plan is to deploy everything with Podman Quadlets and use rootless containers where possible.
Server setup
I’m using Fedora Server, if you missed my reasons check the previous post. The official documentation has everything you need to get started plus post-installation tasks and other tutorials.
Folder structure
By default Fedora Server creates a separate /data partition along side the /, this is helpful to organize you files and backups. I use this partition to store all the configurations I make, it would be better to have this partition in a separate disk but I only have one SSD.
Optimization v2
When I started with Proxmox I created a systemd service to change CPU governor and run Powertop auto-tune to maximise power save. Recently I discovered TuneD a system tuning service that provide easy to apply power profiles with the possibility to create custom ones.
sudo dnf install tunedsudo systemctl enable --now tuned# Show active profilesudo tuned-adm active# List available profilessudo tuned-adm listSince it include changing CPU governor plus other optimizations I’ve decommissioned my old service in favor of the “powersave” profile. I’m still using Powertop auto-tune but this time I use the pre existing systemd service powertop.service to launch it on startups.
sudo tuned-adm profile powersavesudo systemctl enable --now powertop.serviceCockpit modules
To help administrate the system I use Cockpit which is installed by default. It has many features and you can add more by installing additionals applications, some already installed. Make sure to have the following.
sudo dnf install cockpit-storaged cockpit-networkmanager \ cockpit-packagekit cockpit-machines \ cockpit-podman cockpit-selinux cockpit-filesPodman configuration
Similar to Docker you can decide where Podman storage is located. I created a folder /data/podman to store both rootful and rootless containers data.
Rootful container configuration file /etc/containers/systemd/storage.conf
[storage]driver = "overlay"runroot = "/run/containers/storage"graphroot = "/data/podman/root/storage"Rootless container configuration file /home/your-home-folder/.config/containers/storage.conf
[storage]driver = "overlay"graphroot= "/data/podman/user/storage"If you are on a distribution with SELinux you won’t be able to change the graphroot storage location, this happends because SELinux doesn’t allow arbitrary locations for overlay storage. We can solve this issue by applying the same labels of /var/lib/containers/storage to our custom path.
# Rootful storagesudo semanage fcontext -a -e /var/lib/containers/storage# Rootless storagesudo semanage fcontext -a -e /var/lib/containers/storage /data/podman/user/storagesudo restorecon -R -v /data/podman/user/storage# Check if the config is correctpodman infoFinally if we want to run rootless containers with a user that can exit the session we need to set the lingering mode, which allows user processes to be kept running.
sudo loginctl enable-linger your-usernameMonitoring
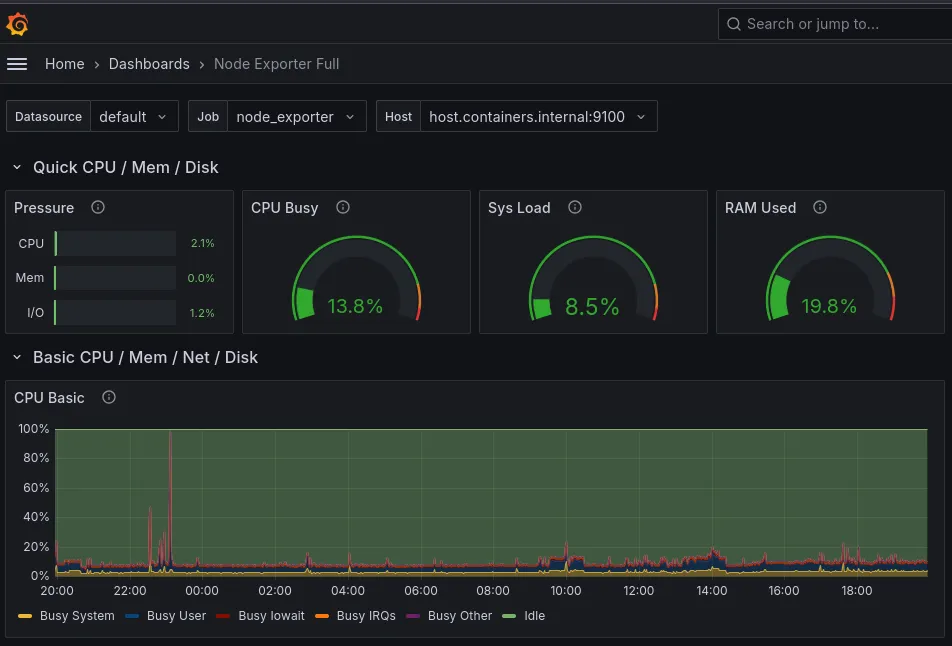
After configuring a server you should setup up some monitoring to keep everything under control, my current setup has Grafana, Prometheus and some exporters. The exporters are: node exporter, podman exporter, fritzbox exporter(for my router stats).
As a quick recap on this stack if you don’t know it:
- The exporter will gather data from the corresponding service and expose it on a specific endpoint like server_ip:port /metrics, this data is not saved and is continiously updated.
- Prometheus scrapes those endpoints after an interval and stores the data along side some labels to make information retrieval of a specific node/host/app possible.
- Grafana connects to Prometheus and, by using a query language, can displays many visualization types for the underling data.
I won’t go into specific Grafana or Prometheus configuration because mine is a basic setup. I’ve not configured any alerting system yet and the exporters dashboards are publicly available.
Grafana
Usually in the Docker world to deploy multiple applications you use Docker Compose(one or multiple compose files) and with the Docker daemon these applications are started on each boot.
Podman does not have a daemon and compose files are not supported unless you use something like podman-compose. The first problem was solved by podman generate systemd but an alternative to compose was still missing until Quadlets arrived. Now you can achieve container startup and declarative configurations using Systemd.
There are six different types of Quadlets: container, network, volume, pod, build, image and kube. Each of these have the same format as systemd files but with an added block depending on their type.
Here is my Grafana container file, as you can see the [Container] block has all the arguments you would use with podman run.
[Unit]Description=Grafana
[Container]Image=docker.io/grafana/grafana-oss:latestAutoUpdate=registryContainerName=grafanaVolume=grafana-data:/var/lib/grafanaPublishPort=3030:3000
[Service]Restart=always
To setup Prometheus and the exporters have a look at their docker run command and translate them to Quadlets like I’ve done with Grafana with the correct adjustments for Podman.
When you need to create a shared volume it is better to create a separate volume file and reference it inside the [Container] block, if I wanted to do it for Grafana it would look like this. The same can be done with networks and pods.
[Unit]Description=Shared grafana volume
[Volume]Label=grafana=grafana-data
Back to the container file.
Volume=grafana.volume:/var/lib/grafanaBut where are these files stored? There are two directories for rootful and rootless containers: /etc/containers/systemd and /etc/containers/systemd/user respectively. After placing the files there you need to reload the systemd daemon depending on the directory. Then you can start the service which has the same name as the Quadlet name.
# rootfulsudo systemctl daemon-reloadsudo systemctl start grafana.service# rootlesssystemctl --user daemon-reloadsystemctl --user start grafana.serviceOne cool feature from Podman is the auto-update command, by using AutoUpdate=registry and an image tag like :latest
in the container file I can update all my applications with podman auto-update, I do not recommend this in a production environment even if it has a rollback feature.
Podman exporter
Since I’m using both rootful and rootless container I cannot use a single instance to monitor both types. The exporter asks for the Podman sock to be mounted inside the container and it differs between the two modes. I had to create two instances with different socket mounted.
# rootfulsudo systemctl start podman.socket# rootlesssystemctl start --user podman.socket# in rootful fileVolume=/run/podman/podman.sock:/run/podman/podman.sock:z# in rootless fileVolume=/run/user/1000/podman/podman.sock:/run/podman/podman.sock:zContainer communication
When working with rootless containers the network is sandboxed by default so you won’t be able to access other containers with the host IP address. There is a special DNS to solve this issue: host.containers.internal which is mapped inside the container /etc/hosts file.
On Fedora, you also need to allow all the rootless containers with a network sandbox permission to expose their mapped ports on the firewall.
sudo firewall-cmd --list-ports# change port number and protocol tcp or udpsudo firewall-cmd --add-port port_number/protocol --permanentsudo firewall-cmd --reload
Grafana is really helpful to understand your server, it is an industry standard afterall. There are many tools for monitoring and maybe I will try a different one in the future. My next steps will be to add an alerting system and automate the Quadlet deployment. This is all still in progress, and I like to test different solutions, which might take some time.
This is my final post for 2024, posted as I write this on New Year’s Eve. See you in 2025!